-
Home
-
About CHARIM
-
Countries
-
Methodology book
-
Use case book
-
Data management book
-
Forum
-
Geonode
You are here
8.5 Analyzing multi-hazards at a national scale
The Caribbean islands are exposed to a number of natural hazards, including river flooding, flash floods, landslides, storm surges, windstorm, tsunami, volcanic hazards, earthquakes, drought and wildfires. Most countries do not have good quality hazard maps for these hazards at the moment. This use case analyzes which areas are threatened by one or more types of natural hazards.
Keywords:
flood hazard; landslide hazard; volcanic hazard; wildfire hazard; tsunami; storm surge; multi-hazard;
| Before you start: | Use case Location: | Uses GIS data: | Authors: |
| Read the related chapter in the methodology book (section 5.4 and section 5.5) | This use case deals with the island of Saint Vincent | Yes, this use case requires GIS data | Cees van Westen and Desmond Shallow |
Introduction:
At a national level it is important for governments to have an understanding of the areas that might be affected by different types of hazards, how frequent that would happen and how many people, buildings, roads and other infrastructure might be affected.
The Eastern Caribbean islands may be affected by a number of natural hazards, such as storm surges, hurricanes, tsunamis, flash flood, debris flows, landslides, drought and forest fires. Compared to single processes, standard approaches and methodological frameworks for multi-hazard risk assessment are less common in the literature, which is related to the complex nature of the interaction between the hazards, and the difficulty to quantify these. One of the difficult issues in natural hazards risk assessment is how to analyze the hazard for more than one hazard type in the same area, and the way they interact. The simplest approach is to consider that the hazards are independent and caused by different triggers. Hazard may be coupled, which means they may be linked to the same triggering event. In that case both events may occur in the same location and cause damage. One hazard may change the disposition of another, making the area more susceptible for the other hazard without occurring simultaneously. And hazards may occur in chains, where one hazard may trigger the next. These hazard chains or domino effects are extremely difficult to quantify over certain areas, although good results have been obtained at a local level). See Methodology book 5.4 for more information on multi-hazards. The table below shows the main multi-hazard relationships for the hazards occurring in the Caribbean countries.
|
|
Earthquake |
Volcanic eruption |
Tsunami |
Storm surge |
River flooding |
Landslides |
Forest fires |
|
Earthquake |
- |
Independent |
Chain |
Independent |
Independent |
Chain |
Independent |
|
Volcanic eruption |
Independent |
- |
Chain |
Independent |
Disposition |
Disposition |
Chain |
|
Tsunami |
Caused by |
Caused by |
- |
Independent |
Independent |
Chain along coast |
Independent |
|
Storm surge |
Independent |
Independent |
Independent |
- |
Chain |
Chain |
Independent |
|
River flooding |
Independent |
Independent |
Independent |
Coupled |
- |
Coupled |
Independent |
|
Landslides |
Caused by |
Independent |
Independent |
Coupled |
Coupled |
- |
|
|
Forest Fires |
Independent |
Coupled |
Independent |
Independent |
Disposition |
Disposition |
- |
Table 1 : Main hazard types in the Eastern Caribbean and the interactions, as described above. The relationship should be read starting from the left and reading horizontally
Although the hazards may have a relation as indicated in Table 1, in practice there are very few studies that have carried out comprehensive hazard assessments that take into account these multi-hazard interactions. Mostly hazards are analyzed separately by teams that have expertise in a particular type of hazard (e.g. volcanic hazard mapping, flood hazard mapping).
The generation of national-scale hazard maps is complicated, and in most cases the national scale maps are only susceptibility maps. A susceptibility map contains a subdivision of the terrain in zones that have a different spatial likelihood that a potentially dangerous phenomena (e.g. flood, landslide etc) might occur. A hazard map also provides information on the expected frequency and magnitude or intensity of the hazardous event (e.g. flood height for a 50 year Return Period).
In some of the islands some progress has been made in the development of such national scale hazard maps. However in most of the cases these maps are still very general, and are mostly susceptibility maps, which express the relative likelihood of hazard in qualitative classes, rather than actual hazard maps, which show the expected intensity for different return periods. There is no metadata for the available hazard maps for the use case area (Saint Vincent), so it is unclear who made the maps and with which methods. After doing some literature review we assumed that these maps were generated by Boruff and Cutter (2007) as part of a study to analyze national scale vulnerability maps for Saint Vincent and Barbados.

Multi-hazards in Saint Vincent. Top: pyroclastic flow related to eruption of Soufriere volcano in 1902, landslide interrupting road in Belmont, windstorm damage. Below: coastal damage in Georgetown, flooding and debrisflow.
Objectives:
The objective of this use case is to analyze the areas that are threathened by one or more types of hazards in a country. We will discuss the problems involved related to the limited hazard information and how frequency and intensity information could be used. We will evaluate for each hazard type how potentially dangerous the hazard type and class would be for buildings and the population inside buildings.
Flowchart:
Use case study area description:
Saint Vincent and the Grenadines consists of 32 islands covering a total of 389 square km, with a total population of approximately 106,000. Saint Vincent, the northernmost island, is the country's commercial and political centre, accounting for 90 percent of both the land area and population.
According to the 2010 National Accounts, the Gross Domestic product of SVG was US$ 583 million. SVG has a poverty headcount index of about 30.2 percent as of 2007/08 and an estimated unemployment rate of 21 percent. St. Vincent and the Grenadines ranks 91st out of 182 countries on the 2007 United Nations Development Program (UNDP) Human Development Index.
SVG is exposed to a range of natural hazards. According to the available disaster statistics (See use case 8.1) earthquakes have not caused significant damage on the eastern Caribbean islands which are part of CHARIM. The same is true of tsunamis. Only limited damage has been recorded on Saint Vincent (NGDC 2003; SRU,2007). However, some researchers are of the opinion that the underwater volcano Kick ‘m Jenny north of Grenada may also produce a tsunami that might be harmful in Saint Vincent (Smith and Shepherd, 1993). There are three historical tsunami events known for Saint Vincent. The 30-year probability of tsunami run-up in excess of 0.5 m in Kingston is considered to be 11.32 % (Parsons and Geist, 2009).
|
Year |
Month |
Day |
Location |
Run-up height in meters |
Where? |
|
|
1755 |
11 |
1 |
Saint Vincent |
4.5 |
||
|
1867 |
11 |
18 |
Saint Vincent |
1.68 |
Beguia island |
|
|
1886 |
3 |
17 |
Saint Vincent |
0.9 |
Bequia Island |
|
Table 2: Historical tsunami events in Saint Vincent
On Saint Vincent, the only active volcano is the Soufriere volcano. In the Volcanic atlas of the Lesser Antilles a detailed description is given of the volcanic situation and the volcanic hazards (Lindsay et al, 2005). The most destructive events in terms of human casualties and losses have been the multiple eruptions of La Soufriere volcano. Volcanic eruptions have affected the country in 1718, 1812, 1902, 1971 and 1979. Three eruptions-in 1902, 1971, and 1979-prompted evacuations of the northern portion of the island. Two of the three events resulted in human fatalities (due to suffocating gases, lahartype debris flows, or volcanic ejecta) and destroyed buildings. During the 1979 eruption a large segment of the travel and communications infrastructure on the islandwas affected as well (Robertson 1995). A summary of historical activity at the Sonfriere volcano (Robertson, 1995) is given below
|
year |
Description |
|
1718 |
Explosive eruption, preceded by one month of earthquake activity. Ashfalls reported on Martinique, St. Kitts, Barbados and Hispaniola. The eruption is estimated to have been the most violent of the historic period (Anderson and Flett, 1903). |
|
1780 |
Increased fumarolic activity - possibly with lava emission. |
|
1811 |
Strong earthquakes. |
|
1812 |
Explosive eruption, preceded by >200 earthquakes during the previous year. Pyroclastic flows, mudflows and ashfalls affected Wallibou to Baleine and Grand Sable to Tourama. Fifty-six people were estimated to have died and a new crater formed. |
|
1814 |
Small eruption with rocks thrown 0.5 km from the crater. |
|
1880 |
Crater lake temperatures increased with a major rise in water level. There was an increase in fumarolic activity with possible emission of lava (dome). |
|
1901 |
Strong earthquakes. |
|
1902-03 |
Explosive eruption, preceded by 12 months of earthquake activity. Pyroclastic flows, mudflows and ashfalls affected areas to the north-east, east and west of the volcano. At least 1565 died and extensive damage was caused to agriculture in the areas around the volcano. |
|
1945-46 |
Local earthquake swarm accompanied by an increase in fumarolic activity. |
|
1948-54 |
Increase in water temperature of the crater lake. |
|
1971-72 |
An aseismic effusive eruption resulting in discharge of 80 x 106 m3 of lava into the crater lake. The lake level rose 30 m destroying vegetation along the inside crater walls. Communities located north of the Rabacca dry river were evacuated. |
|
1978 |
Local earthquake swarm. |
|
1979 |
Explosive eruption accompanied by effusive activity. The eruption was preceded by increased earthquake activity, an increase in crater lake temperature and a slight inflation of the volcano flanks. There were no fatalities but extensive damage to crops and livestock. The total cost of eruption to the economy was estimated to be above 5.2 m USD. There was evacuation of >14,000 people from areas north of Union Village (east) and Belleisle Hill (west). |
Table 3: Historical volcanic eruptions in Saint Vincent
Saint Vincent and the Grenadines is located in the Atlantic hurricane belt and has suffered periodic damages from past events e.g. from Hurricane Allen (1980), Hurricane Lenny (1999), and Hurricane Tomas (2010). As a result of its volcanic origin, steep slopes dominate the island’s landscape and tilted volcanic layers define the geology and soils. In combination with high temperatures and abundant rainfall, this leads to slope instabilities and the potential for landslides. The first work done on landslides was by De Graff who identified in 1988 about 475 landslides, covering about 1% of the country’s surface. In the CHARIM project Van Westen generated a new landslide inventory for Saint Vincent, with 1632 landslides, covering 667 hectares. The most common type of landslides in SVG are debris flows (1011). These are defined as rapid movements of a mass of soil, water and air, posing a significant threat to human lives since they can travel long distances, approach fast and exhibit a considerable destructive force.
Saint Vincent has more than 40 rivers and tributaries, which originate in the central mountains and discharge to the Caribbean Sea or the Atlantic Ocean. Often villages and towns are located along those rivers, especially near the coast in the flatter areas that leads to increased debris flow and flood risk.
Recent statistics from the Forest Department and accounts from historic texts illustrate the frequency of fire events . Bonham Richardson (2004) points out that fire, primarily human-induced fire, has “cleared forests, burned sugar cane, sparked slave rebellions, insurrections, attracted crowds, lighted streets and houses, and symbolized protest in the region for centuries.” Not only have sugarcane fires burning out of control or set as acts of defiance created economic hardships for plantation owners and laborers, but wildfires have damaged commercial and residential structures, affected island infrastructure, and, in some cases, resulted in deaths (Richardson 2004). Because fire hazards are ubiquitous, especially on densely populated Barbados, annual events often number in the hundreds (B. C. Richardson 1998).
Data requirements:
For this use case we require national scale hazard and susceptibility maps. The maps that are available for Saint Vincent are summarized in table 4. For one hazard type (river flooding) we have maps that show water depth for different return periods. For storm surges, we have maps representing the expected extent of flooding for different return periods, however without depth information. For tsunami hazard we only have the run-up areas that are situated within 1.87 meters elevation from the coast, without data on return periods. For other hazard types (volcanic hazards, landslide hazard and forest fires) we only have maps representing the relative spatial likelihood of the hazard, without information on the frequency and the intensity. We did not have hazard maps for two types of hazards: wind, and drought.
|
Hazard type |
Intensity |
Return Period |
Type of map |
Source |
|
Tsunami |
1.87 meters |
No direct information |
Susceptibility map |
Boruff and Cutter (2007) Smith and Shepherd (1993) |
|
Storm Surge |
Flood extent |
10 years |
Hazard maps, although they do not show intensity as water height they do show extent for different return periods |
CDMP (2000) and Boruff and Cutter (2007) |
|
Flood extent |
25 years |
|||
|
Flood extent |
50 years |
|||
|
Flood extent |
100 years |
|||
|
River flooding |
Water depth |
5 years |
Hazard maps, showing water height for different return periods. |
CHARIM project (Jetten) |
|
Water depth |
10 years |
|||
|
Water depth |
20 years |
|||
|
Water depth |
50 years |
|||
|
Volcanic hazards |
Relative classes |
No direct information |
Susceptibility map |
Lindsay et al, (2005); Robertson (1995) |
|
Landslides |
Relative classes |
No direct information |
Susceptibility map |
CHARIM project (Van Westen) |
|
Bushfires |
Relative classes |
No direct information |
Susceptibility map |
Forest Department |
Table 4 : Overview of the susceptibility and hazard maps available for Saint Vincent, with indication of the information content and whether information is available for different return periods
Ideally national scale hazard maps should represent the spatially distributed expected intensity (e.g. water depth, wind speed) for different frequencies and for different hazard types (coastal flooding, river flooding, landslides, tsunamis, volcanic eruptions, forest fires). So in fact one hazard map could consist of several maps that display the intensity per return period. The maps that are available for Saint Vincent partly fulfill this requirement. For one hazard (river flooding) we have maps that show water depth for different return periods. For some of the hazards, in particular for tsunamis, and coastal flooding, we have maps representing the expected extend of flooding for different return periods, however without depth information. For other hazards (volcanic hazards, landslide hazard and forest fires) we only have maps representing the relative spatial likelihood of the hazard, without information on the frequency and the intensity. We did not have hazard maps for two types of hazards: wind, and drought. However, given the objective of this use case (to develop a multi-hazard map indicating development restrictions due to natural hazards, and estimating the national level exposure), these two hazards are less suitable to include. The reduction of wind speed damage is related mostly to the building construction standards, and not so much to the spatial location of buildings, and it is not very likely that windspeed and drought would be used spatially to restrict housing development in certain areas.
Tsunami susceptibility map
 A tsunami map was available for Saint Vincent, without any metadata. We do not know who made this map, in which year, and based on which method. The map was probably made by Boruff and Cutter (2007). They outlined tsunami inundation zones for Saint Vincent using wave run-up values for a realistic scenario event at Kick ’em Jenny (Smith and Shepherd, 1993). They selected DEM grid cells with an elevation value below the predicted run-up value for each island: 1.87 meters on Saint Vincent. They then recalculated inundation values for the “volcano-facing” coastline of each island based on Smith and Shepherd’s (1993) predicted values, because no data were available to incorporate the effects of refraction on the tsunami waves. So basically the maps indicate the coastal areas that are less than 1.87 meters above sea level. The table below contains records of reported tsunami events in Saint Vincent (Parsons and Geist, 2009).
Volcanic hazard map
 The available volcanic hazard map comes from the Seismic Research Unit of the University of the West Indies-Saint Augustine, Trinidad (Lindsay et al, 2005) which made this map based on an updated version of the map produced by Robertson (1995). Robertson (1995), indicates that in the short term (<1000 years), the volcanic hazard at Soufriere is expected to be quite similar to that experienced in the historic past. The volcano would become hazardous whenever in activity, remaining for the intervening periods a threat which must be catered for in national development plans. Activity during this period could be one of two types, explosive or effusive. Both events may be separated in time but can be regarded as part of a two phase pattern of eruption. The scale of the explosive phase is expected to range from that of a 1979-type event to that of a 1902-type event. The effusive phase is expected to be quite similar to the 1971-72 eruption. In the longer term (>1000 years), allowance must be made for the possibility of cataclysmic Plinian to Ultraplinian activity fluctuating with Strombolian type eruptions. Although there are no historical records of such activity, the presence of thick post-Pleistocene ashfall deposits throughout St. Vincent as well as thick scoriaceous beds on the lower flanks of the volcano demonstrates that the Soufriere has the capacity for events of this type. As the repose period since the last eruption of this type increases, it is expected that the probability of such an occurrence also increases. The explanation of this map is given below, taken from Robertson (1995)
|
Zone |
Description |
|
Zone 1 Red zone, Near crater |
Areas with total destruction from pyroclastic flows, surges, mudflows and projectiles. All areas covered in a minimum of 20 mm ash, whatever the scale of eruption. The zone would be unsuitable for human habitation. |
|
Zone 2 Red zone |
Areas affected in a similar manner as Zone 1 during larger scale eruptions. The zone is somewhat sheltered by topographic highs from the direct impact of pyroclastic flows, mudflows and ballistic projectiles. The potential for damage is similar to Zone 1 but the greater distance of villages from the volcanic centre would reduce the human impact. |
|
Zone 3 Orange zone |
The area would experience reduced physical damage compared to the red zone. This area is free from the effects of pyroclastic flows, surges and mudftows. It will be affected by thick ashfalls, minor earthquakes and lightning strikes. The 200 mm isopach for 1902-scale eruptions is taken as the northern boundary of this zone. Damage to flora may be restricted only to foliage with root systems left intact. Despite relatively minor impact on the physical infrastructure, hazardous events may still cause major problems for the human population. The area would be included within the zone of total devastation during eruptions expected in the long term. |
|
Zone 4 Yellow Zone |
Area expected to experience relatively minor physical impact from eruptions. The 50 mm isopach for 1902-scale eruptions is taken as the northern boundary of this zone. Crop damage and disruption of water supply due to ashfalls will be the main effect but other physical damage would be minimal. The close proximity of an erupting volcano may however have an adverse effect on the mental state of the local population. |
|
Zone 5 Green zone |
This is a relatively safe zone. Infrequent heavy ashfalls may occur due to entrapment of ash from low level eruption columns in local winds which blow towards the south-west. Impact of the eruption would be felt mainly in terms of the additional burden place on resources by people evacuated from higher risk zones further north. During high magnitude eruptions expected in the long term, this area would be more strongly affected by ashfalls. |
Table 5: Explanation of the legend of the volcanic hazard map
Storm surge hazard
 For Saint Vincent a storm surge hazard map is available in the form of 4 maps with flood extend for return periods of 10, 25, 50 and 100 years. The source of the maps is not clear, but it is probably derived from the studies of CDMP (2000) and Boruff and Cutter (2007). They estimated storm-surge inundation zones using outputs from The Arbiter of Storms (TAOS) model developed by the Caribbean Disaster and Mitigation Project (CDMP 2000). Model outputs estimated surge heights and, when registered to each islands DEM produced a hypothetical flooding of coastal locations. The TAOS model produces several outputs, including wave and surge height; based on recommendations from the CDMP.
Landslide susceptibility map
 In the CHARIM project Van Westen generated a new landslide inventory for Saint Vincent, with 1632 landslides, covering 667 hectares (See use case 8.3). Also the runout areas of the debrisflows were mapped, therefore the surface area of the unit “Streams_with_flood_and_debrisflows” have the largest surface area. The method for the landslide susceptibility map consisted of several steps. This process was done through a combination of statistical method (Weights of Evidence – WOE) and expert-based methods (Spatial multi-criteria Evaluation - SMCE). This analysis was done per type of landslide, and per landslide inventory. The method is described in use case 8.3 and Methodology book section 4.2.
Flood hazard map
 In the CHARIM project Jetten generated a new flood hazard map for Saint Vincent. The flood hazard assessment was based on flash flood modeling of the entire island (all watersheds in one simulation). The flood modeling procedure is further described in use case 8.7 and session 3.3 of the Methodology book.
Forest fire susceptibility map
 For Saint Vincent we obtained a Forest fire map through the Forest Department. The map indicates a number of polygons, on the East and Southeastern part of the island, with a weight indicating the degree of hazard ranging between 0 and 1. There is no metadata available that explains the method which was followed for generating the map, nor is it know whether the map is complete, and whether wildfires are restricted to the indicated areas.
Analysis steps:
Comparing multi-hazards at national scale
The data analysis follows a number of steps, for the generation of the multi-hazard map which is used as a basis for indicating the areas that are not suitable for development based on the presence of one or more natural hazards
Applying equal weights
The generation of the multi-hazard map can follow several approaches. Boruff and Cutter (2007) assigned a value of 1 to low hazard areas (for each hazard type), 2 for moderate hazard and 3 for high hazard areas. They then added the weighted maps and generated a score map presenting multi-hazards. If we would do this the results might look like the ones in the table below.
|
Hazard type |
Hazard / susceptibility classes |
|||
|
Low |
Moderate |
High |
Very high |
|
|
Tsunami |
- |
- |
- |
<1.87 m: 4 |
|
Storm surge |
10 year RP: 1 |
25 year RP: 1 |
50 year RP: 3 |
100 year RP: 4 |
|
Flooding |
5 year RP: 1 |
10 year RP: 1 |
25 year RP: 3 |
50 year RP: 4 |
|
Volcanic hazards |
Low: 1 |
Moderate: 2 |
High: 3 |
Very high: 4 |
|
Landslides |
Low: 1 |
Moderate: 2 |
High: 3 |
Very high: 4 |
|
Forest fires |
Low: 1 |
Moderate: 2 |
High: 3 |
Very high: 4 |
Table 6: assigning weights to the classes of the individual hazard/susceptibility maps according to the method of Boruff and Cutter (2007)
The range of output values would be between 1 and 24 depending on the combination of the six maps. The problem is that the hazard types are treated equally, which may be problematic as the impact of the hazards is quite different. Also the frequencies might be quite different as well. for example the frequency highest class of the storm surge hazard map is one per 100 years, and of the flood maps once per 50 years. Several other maps do not show frequency information at all.
Comparing the hazards
We will evaluate for each hazard type how potentially dangerous that hazard would be for buildings and the population inside buildings. The intensities of the various hazard types is considered quite different with respect to the impact on buildings, as indicated in the table below.
|
Hazard type |
Intensity |
Frequency |
Impact on buildings |
|
Volcanic hazard |
Pyroclastic flow deposits |
Frequency is low, maximum once 30 years, but large events will be very destructive |
Complete destruction of buildings exposed. All people exposed will be killed |
|
Ash fall |
Buildings may have severe damage if roofs are covered by thick ash, followed by rainfall. People are generally less at risk, but livestock is at risk of gastrointestinal deceases |
||
|
Lahar |
Almost complete destruction of buildings exposed. Many people exposed will be killed, unless there is a sufficient warning |
||
|
Landslides |
Debris flows |
Landslide may occur annually but large events every 5-10 years. Only part of the class affected |
Severe damage of buildings exposed. Many people exposed will be killed, unless there is a sufficient warning |
|
Landslides |
Severe damage of buildings exposed. Relatively few people exposed will be killed, as landslide development may lead to sufficient time to escape, unless it happens during the night. |
||
|
Coastal surge |
Water depth |
10, 25, 50 and 100 years Return periods |
Buildings may have some structural damage, and severe damage to the contents of the buildings. Relatively few people exposed will be killed, as landslide development may lead to sufficient time to escape, unless it happens during the night. |
|
Tsunami |
Water depth |
Frequency between 50 and 100 years. |
Given the relatively low expected height, buildings may have some structural damage, and severe damage to the contents of the buildings. Relatively few people exposed will be killed, as landslide development may lead to sufficient time to escape, unless it happens during the night. |
|
River flooding |
Water depth |
5, 10, 25 and 50 years Return periods |
Buildings may have some structural damage, and severe damage to the contents of the buildings. Relatively few people exposed will be killed, as landslide development may lead to sufficient time to escape, unless it happens during the night. |
|
Forest fires |
Fire |
May occur every few years, but impact is small |
Exposed building will be destroyed if insufficient firefighting capacity is available. Relatively low danger to humans, as there is normally enough time to evacuate. |
Table 7: Presentation of the various hazards, with their individual processes and intensities, the expected frequencies and expected impact on buildings and population.
As can be seen from this table a lot of information is still missing to be able to fully quantify multi-hazards. Therefore we decided to analyze the areas subjected to each type of hazard and show the results per parish.
Global Multi-Hazard Risk Analysis Results from GAR Risk Data Platform
Also the analysis Multi-Hazard risk was compared with the results from the Global Assessment Report on Disaster Risk Reduction (GAR) in 2015. All available data from GAR 13's Global Risk Update is provided an interactive platform for viewing and downloading.
Figure: GAR Risk Data Platform developed by the World Bank, CIMNE, ERN and Ingeniar, showing the detail of information used for Saint Vincent

It is presented in an easily accessible manner, over the Internet. The global risk update featured in the Global Assessment Report 2015 is based on a joint effort by leading scientific institutions, governments, UN agencies and development banks, the private sector and non-governmental organisations. This platform is a multiple agencies effort to share spatial data information on global risk from natural hazards. You will be able to visualise, download or extract data on past hazardous events, human & economical hazard exposure and risk from natural hazards. It covers major hazards, initialy tropical cyclones and earthquakes and as it becomes available, information related to storm surges, drought, floods, landslides, tsunamis and volcanic eruptions.
This software was developed by UNISDR in collaboration with the World Bank, CIMNE, ERN and Ingeniar, with the generous financial support of the European Commission, and it is free, open source, under the Apache 2 license. It is conceived to be a module of the CAPRA (Comprehensive Approach to Probabilistic Risk Assessment) software suite of products (see www.ecapra.org), but it can be used in standalone form as a Spatial Data Infrastructure (SDI) and web mapping service for a wide range of applications.
Results:
The Global Assessment Report on Disaster Risk Reduction 2015 has carried out a Multi-Hazard risk assessment for all countries in the world, including Saint Vincent and the Grenadines.
Figure: Information on Saint Vincent for the country risk profile of GAR 2015

Figure: Risk results for Saint Vincent developed under the GAR 2015.
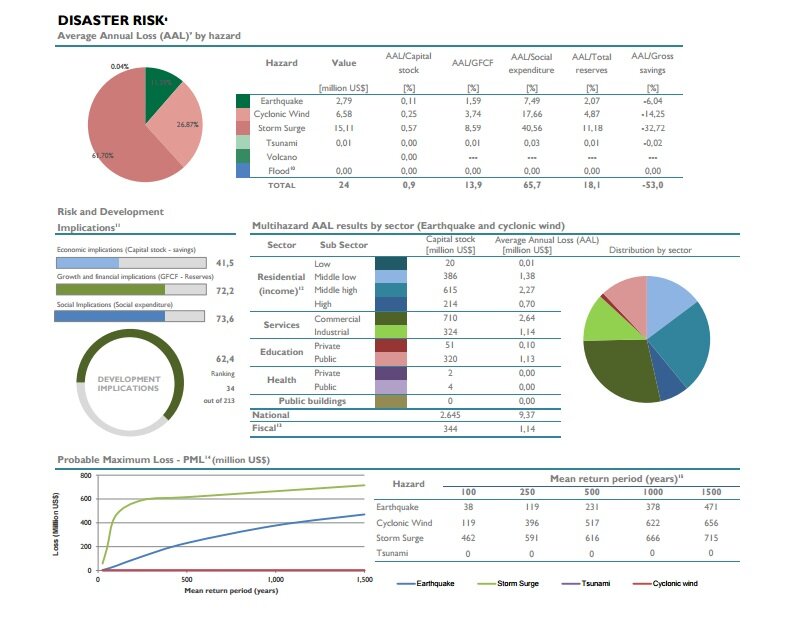
Within this framework also multi-hazard risk was assessed, using input data with a very coarse resolution. For Saint Vincent this was about 10 by 10 kilometers, so that the entire island was covered by 25 pixels only. Nevertheless the project was able to assess the following metrics:
- Extensive risk is used to describe the risk of low-severity, high-frequency disasters, mainly but not exclusively associated with highly localized hazards. Intensive risk is used to describe the risk of high-severity, mid to low-frequency disasters, mainly associated with major hazards.
- AAL: The Average Annual Loss is the expected loss per annum associated to the occurrence of future perils assuming a very long observation timeframe. It considers the damage caused on the exposed elements by small, moderate and extreme events and results a useful and robust metric for risk ranking and comparisons. AAL Flood results are provisional. These results give an overview of the risk associated with river flooding. Factors other than the depth of the water also have a considerable influence on loss, which means that there is greater uncertainty compared with other hazards.
- Risk and development implications index. This index is useful to provide a ranking of the countries based on the ratio of the expected Average Annual Loss (AAL) with relation to a set of relevant macroeconomic, financial, and social development variables. It attempts to reveal the weight of the AAL with respect to the social expenditure, the capital formation (domestic investment) and reserves (financial capacity), and the produced capital or capital stock (assets at risk) and savings (treasury) of each country. It reflects, in adverse conditions, growth and social constraints for the country as a result of potential future disasters.
- The fiscal portfolio is composed by the government buildings, public education and health buildings, and low income residential private buildings.
- PML: The Probable Maximum Loss is a risk metric that represents the maximum loss that could be expected, on average, within a given number of years. PML is widely used to establish limits related to the size of reserves that, for example, insurance companies or a government should have available to buffer losses: the higher the return period, the higher the expected loss. PML always have associated a mean return period. Mean return period of 100, 250, 500, 1000 and 1500 years means the 5%, 2%, 1%, 0.5% and 0.3% probability respectively of exceeding those losses in 5 years.
Conclusions:
The national scale hazard maps have to be further improved. The hazard maps for volcanic hazards, river flood hazard, and landslide hazard are up to standards, and the storm surge hazard maps might be further improved by adding water depth information. The tsunami hazard map should also contain some more indication of the temporal probability of occurrence. The forest fire hazard map should be extended to the entire island. Currently missing hazard maps related to wind speed and drought should still be produced.
Only after producing detailed maps for each of these hazards, that show intensities for different return periods, at a detailed scale it will be possible to calculate exposure, and risk and to incorporate these maps into spatial planning and disaster risk management.
References:
Boruff, B.J. and Cutter, S.L. (2007). The Environmental Vulnerability Of Caribbean Island Nations. The Geographical Review 97 (1): 24-45,
CDMP [Caribbean Disaster Mitigation Project]. 1999. The TAOS/L Storm Hazard Model and CDMP TAOS/L Applications. Implemented by the Organization of American States, Unit of Sustainable Development and Environment for the USAID Office of Foreign Disaster Assistance and the Caribbean. Regional Program. http://www.oas.org/CDMP/hazmap/taos/taosdoc/taosfull.htm
CDMP (Caribbean Disaster Mitigation Project ) 2000. Atlas of Probable Storm Effects in the Caribbean Sea. Implemented by the Organization of American States, Unit of Sustainable Development and Environment for the USAID Office of Foreign Disaster Assistance and the Caribbean Regional Program
DeGraff, J. (1988). Landslide hazard on St. Vincent, West Indies. Fresno, California.
DeGraff, J.V., Bryce, R., Jibson, R.W., Mora, S., and Rogers, C.T. 1989. Landslides: Their extent and significance in the Caribbean. In E.E. Brabb and B.L. Harrod (eds), Landslides: Extent and Economic Significance. p. 51-80. Rotterdam: A.A. Balkema
Fiske, R.S., and Sigurdsson, H., 1982, Soufriere volcano, St. Vincent: Observations of its 1979 eruption from the ground, aircraft, and satellites: Science, v.
216, p. 1105-1126
Kappes MS, Keiler M, Von Elverfeldt K, Glade T, (2012). Challenges of analyzing multi-hazard Risk: A Review. Natural Hazards 64(2), 1925-1958
Lindsay, J.M., Robertson, R.E.A., Shepherd, J.B. and Ali, S. (2005) Volcanic Hazard Atlas of the Lesser Antilles. University Of The West Indies
NGDC [National Geophysical Data Center]. 2003. Tsunami Data at NGDC. Boulder, Colo.: National Geophysical Data Center. [www.ngdc.noaa.gov/seg/hazard/tsu.shtml].
Parsons, T. and Geist, E.L. 2009. Tsunami Probability in the Caribbean Region. Pure appl. geophys. 165 (2009) 2089–2116. Available from : http://woodshole.er.usgs.gov/project-pages/caribbean/pdf/Parson_Geist_PAGeoph2009.pdf
Richardson, B. C. 1989. Catastrophes and Change on St. Vincent. National Geographic Research 5 (1): 111-125.
Richardson, B. C. 2004. Igniting the Caribbean’s Past: Fire in British West Indian History. Chapel Hill: University of North Carolina Press.
Robertson, R. E. A. 1995. An Assessment of the Risk from Future Eruptions of the Soufriere Volcano of St.Vincent, Natural Hazards 11 ( 2 ) : 163-19
Smith, M. S., and J. R. Shepherd. 1993. Preliminary Investigations of the Tsunami Hazard of the Kick'em Jenny Submarine Volcano. Natural Hazards 7 (3): 257-277.
SRU [Seismic Research Unit]. (2005). Volcanoes. University of the West Indies, Seismic Research Unit.
SRU [Seismic Research Unit]. (2007). Earthquakes. University of the West Indies, Seismic Research Unit.
Last update:
01 - 04 - 2016
Post new comment