-
Home
-
About CHARIM
-
Countries
-
Methodology book
-
Use case book
-
Data management book
-
Forum
-
Geonode
You are here
8.6 National flood hazard assessment for river flooding
Keywords:
National, flood, hazard, assessment, hydrodynamic modeling, rivers
| Before you start: | Use case Location: | Uses GIS data: | Authors: |
|
Be familiar with the reasons for the inception of the CHARIM project and its aims. Some knowledge of the concepts of flood modeling and GIS mapping from the methodology book would be useful prerequisites, but are not essential for a general understanding of this Use Case. |
This is illustrated using a summary of the national scale fluvial flood hazard assessment for Belize (see full technical modeling report for more details). |
Outputs are indicative flood hazard GIS raster layers for the CHARIM project. |
Mark Trigg, Christopher Sampson, Andrew Smith |
Introduction:
Belize is exposed to three major types of flood hazard: river flooding (fluvial), surface water flooding from high intensity rainfall (pluvial), and coastal flooding from storm surges (coastal). These flood hazards bring serious risk to the country’s people, infrastructure and economy. This is particularly the case during tropical storms and hurricanes, when all three flood hazards can combine to cause havoc across the country, for example Hurricane Richard in 2010. Hurricane Richard caused an estimated $80 million (2010 USD) in damages, much of which was in Belize.
The National Hazard Mitigation Policy of Belize (April 2004) aims to provide an integrated approach to hazard risk management and sustainable development, at national, sector and community levels. The guiding principles of the policy highlight the value of vulnerability assessment and reduction and that sustainable development can only be achieved if hazard risk reduction becomes an inherent part of development planning. In order for these aims to be achieved on a practical decision making level, information on the spatial extent and severity of the flood hazards is required. This requires national flood hazard maps showing information on a map about places that may be at risk from flooding. The national flood hazard maps developed for Belize in the CHARIM project include all three flood hazards; fluvial, pluvial and coastal. This Use Case focuses in particular on the assessment of fluvial flooding hazard from rivers. More specific detail on the methodology and how other flood hazards are assessed can be found in the national flood hazard modeling technical report (Belize NFHM Methodology Report).
Objectives:
- A fluvial flood hazard assessment is required to provide a national scale mapping of the indicative flood hazard from all rivers across the entire country.
- This Use Case aims to give planners and engineers an appreciation of how this national scale assessment was carried out for Belize, without being overloaded with too much detail. It should give you an awareness of the data required, methods used, as well as the resulting accuracy and limitations of the output data in order to be able to use the output more effectively in your day-to-day work.
- The assessment must use best available existing data. While much of the required data will need to be derived from coarse global datasets, due to the relative data scarcity in Belize, the use of local knowledge and data will be important to improve and validate these global datasets where possible.
- Employ state-of-the-art hydrodynamic modeling methods that are computationally fast, due to the large area to be modeled. Methods also need to be robust to poor quality or coarse data, whilst being able to incorporate high quality local data, where available.
- To define flood hazard for a range of probabilities of occurrence (chance of happening), e.g. 1% probability (sometimes referred to as 1-in-100 year return period).
Flowchart:
Click on the flowchart to open a graphical summary in another window.
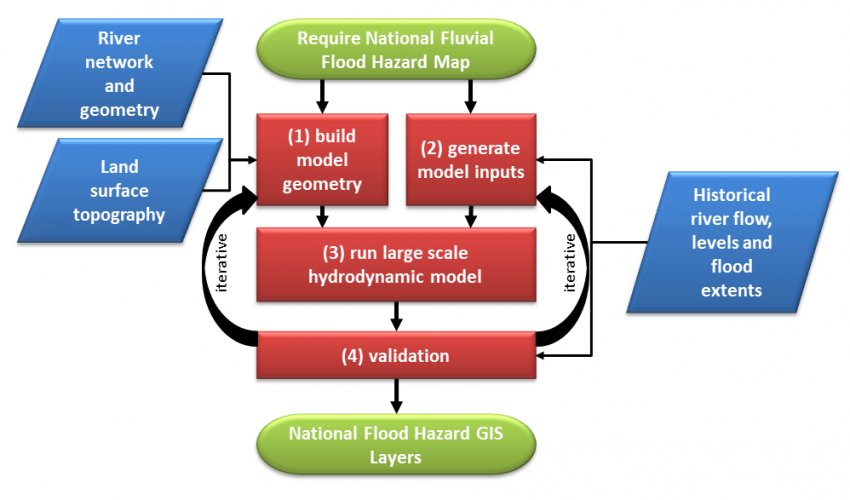
For a more detailed flow chart see Methodology Book 3.4.
Problems definition and specifications:
A national scale flood hazard assessment for Belize requires a consistent methodology that can be applied to the whole country (35 major river systems over 23,000 km2), so that a reliable quality output is achieved. Commonly, national scale assessments are carried out at a coarser resolution than local scale engineering assessments due to data limitations and high computational requirements. The resolution and accuracy of the output maps of flood extent and magnitude need to be usable in order to identify high risk areas in the country for national planning and mitigation purposes. A national scale hydrodynamic model is therefore required to achieve this.
Data requirements:
River Network: In order to model (simulate) the national rivers of Belize, we need information as to their location and channel size so that the model knows how much water they can hold before it comes out of the channel. The river network, upstream accumulating area, and geometry are derived from the HydroSHEDS dataset (hydrosheds.cr.usgs.gov). HydroSHEDS is a mapping product that provides hydrographic information for regional and global-scale applications in a consistent format and is derived from Shuttle Radar Topography Data (~90 m spatial resolution). The river network and upstream accumulating areas (catchment) can be estimated in an automated fashion from the DEM, with subsequent manual validation and correction where necessary. It is also necessary to measure channel width from detailed satellite images and estimate the channel depths using geomorphological relationships that relate the channel size to upstream catchment area.
River flows: The national model of the rivers also requires discharge (or flow) data for each flood probability that is to be modeled. Ideally these are derived from gauged flow data (measured at a particular location for many decades), however, as there are very few gauging stations in Belize and we need flows at many thousands of locations across the country, we need to estimate these using a regionalized flood frequency analysis (RFFA). This uses the behavior of flooding measured in similar rivers globally in order to construct design hydrographs for return period flood events at any point in the country.
Terrain elevation data: When the national river model simulates the design flows in the river channel and the flow is too large for the channel, the water comes out of bank and onto the floodplain. The model will then need elevation data that defines the terrain (topography) in order to simulate where this flood water will go and how deep it will be. For this, we use a Digital Elevation Model (DEM). Currently, the best available DEM data for Belize is that from the Shuttle Radar Topography Mission (SRTM, www2.jpl.nasa.gov/srtm/). A major problem with using SRTM data for hydrodynamic modeling of a floodplain is that it is not “bare-earth” and contains information about vegetation and urban areas that block the water movement in the model. To remove this unwanted information, we correct the DEM using other data such as spatial urbanization data (satellite luminosity data) and vegetation data (MODIS Vegetation Continuous Field, VCF).
Analysis steps:
The National Flood Hazard Assessment has been undertaken using a state-of-the-art Global Flood Hazard Framework developed by SSBN Ltd. It builds on 15 years of published research developed at the University of Bristol in the UK into fast, detailed hydrodynamic modeling of large scale flood hazard using global datasets to supplement local data where it is scarce. All the datasets used in the model are freely available as open access data. The LISFLOOD-FP hydrodynamic model software at the core of the method is available on request from the University of Bristol. The details of the framework putting all of these elements together is published, but it application requires a high performance computing system in order to run the simulations. Below is a brief description of the framework and of its application to Belize, linked to the flow chart by section number.
General Application
(1a) Terrain Pre-Processor
The relevant 3 arc second (~90 m) SRTM terrain tiles are extracted and joined to create a continuous DEM of the entire country. Urban areas are identified using satellite night time luminosity data and depending on the degree of urbanization, a filter of varying strength is applied to the SRTM data to remove local high points (which represent building roofs) and reconstruct the surface by interpolating between the remaining lower points. Unwanted vegetation elevations are removed using an algorithm based on a global satellite based vegetation height dataset and canopy density dataset. A feature preserving smoothing algorithm is applied to the entire DEM to reduce the data noise error inherent to SRTM data. This results in a continuous, robust “bare-earth” digital elevation model of the whole country suitable for hydrodynamic modeling of river floodplains and coastal regions.
(1b) Channel Pre-Processor
It is critical to explicitly model river channels within flood models, as most water is conveyed across the land surface within them and their omission leads to severe over estimation of flood hazard. The channel network is generated using GIS-based hydrological analysis tools; the basic network used here was created as part of the HydroSHEDS project. The HydroSHEDS network for Belize was validated against the national river layer provided by the Government, with corrections made where necessary to ensure the data represented the national rivers correctly. Belize specific relationships of river width to upstream catchment area can be built by using aerial and satellite photography that relate measured river width to upstream accumulating area derived from the DEM. This relationship can then be used to estimate an appropriate width for all river channel cells within the model. River depth can be estimated using the Manning’s equation (see Methodology Book section 3.4 Fluvial Flood Modeling) which relates flow to the channel capacity. To apply Manning’s equation we assume a bankfull discharge from the RFFA (see 2a), river width from the relationship described above, slope from the DEM, and typical channel roughness.
(2a) Regional Flood Frequency Analysis (RFFA)
The RFFA has been developed to enable return period discharges to be estimated anywhere on Earth based only on climate classification, upstream area and upstream annual rainfall. It uses a database of river discharge measured for many decades at 945 river gauging stations all over the globe, representing 70,353 station years of data. This method is used to generate robust flood flow estimates at any point along the river network in Belize. By making an assumption of bankfull return period (typically ~ 1 in 2 years) it is also possible to estimate bankfull discharge using the RFFA, used in step 1b to estimate channel depth. Local gauging station data is quality assessed and used to validate RFFA flows where available.
Note that the RFFA method operates for channels with an upstream area of greater than 40 km2. For channels below this size, intense rainfall is simulated within the hydraulic model as rainfall directly on the DEM terrain. The rainfall intensity for an event of given duration and return period is estimated using Intensity Duration Frequency (IDF) curves generated from local rainfall data if available, otherwise by using regional IDF curves.
(2b) Boundary Condition Pre-Processor
Hydrographs representing the change in flood flow over time are required to model the flood dynamically over time, allowing the model to account for water stored on the floodplain. These hydrographs are generated using the assumption of a triangular hydrograph, with the peak flow represented by the flow derived in 2a and the time-to-peak estimated by using Manning’s equation to calculate mean velocities along the length of the river network to the furthest point.
(3a) Hydrodynamic Model Build
The river network is decomposed (divided) into reaches, with each reach simulating its own flood hydrograph. Reaches are divided where the bankfull discharge changes by more than 5%, typically this is at river confluences and change points along the river network. Downstream boundary conditions are set to sea level if terminating in the ocean, or at DEM elevation if terminating inland.
(3b) Hydrodynamic Model Run
The models are executed (run) using a full 2D hydrodynamic model based on a simplified (for speed) momentum-preserving variant of the shallow water equations. The hydrodynamic model explicitly models channels using a sub-grid method that means the channel geometry is independent from the model grid resolution (DEM), allowing channels of all sizes to be represented even when modeling with coarser DEMs like SRTM.
A surface water routing scheme is incorporated into the model to handle situations where the assumptions underlying the shallow water equations are violated. This usually applies to areas of very steep or discontinuous terrain. The routing scheme moves water downslope at a velocity that is dependent on slope gradient; the velocity-gradient relationships were developed from empirical studies of surface water flow velocities.
Large rivers are modeled at 30 arc second resolution (~1 km), as a coarser grid produces a more stable simulation of water surface elevation on large flood plains. This is because coarsening the DEM reduces the noise present in SRTM terrain data. Small rivers and pluvial simulations are simulated at 3 arc second (~90 m) resolution, as the higher resolution is necessary to resolve the small scale topographical features that constrain the flow of smaller channels.
(4a) Post Processor
The 30 arc second (~1 km) simulations of large rivers are reprojected onto the 3 arc second (~90 m) DEM by interpolating between water elevations at the center of each 30 arc second cell to create a smooth 2D surface of water elevations at 3 arc second resolution. Simulations of individual reaches are combined to create a continuous flood hazard map.
(4b) Validation
Validation of both input data and output results was carried out wherever existing local data was available and appropriate for the purpose. Validation of the river network against national network data showed model network errors located along Monkey River and were corrected to correspond with national network data and satellite imagery. Validation of flows and rainfall values from regional data were tested against quality assessed local data. In addition, the regionalized IDF curves used in Belize were compared to IDF relationships that have been derived in other, similar regions (e.g. Miami, Florida). Some localized LIDAR topography was used to assess the success of vegetation correction of the SRTM DEM. Flood hazard maps were also compared to previous flood related studies (Meerman, October 2008 Landsat flood extent; King et al., 1992 – geomorphological assessment) and compared with Ministry of Works and Transport (MOWT) records of flood locations and National Emergency Management Organization (NEMO) photographs and reports of hurricane flood damages.
Example Application
This method has been applied to the entire country of Belize for the CHARIM project. See the results section below for a summary description of the outcome. For more details please see the full technical modeling report on the national scale fluvial flood hazard assessment for Belize.
Results:
The flood hazard assessment modeling output is in the form of a series of GIS layers (raster or vector), which represent the indicative flood hazard extent for each probability modeled. Specifically these are for the 1-in-5, 10, 20, 50, 75, 100, 250, 500 and 1000 year return periods. This corresponds respectively to a 20%, 10%, 5%, 2%, 1.3%, 1%, 0.4%, 0.2%, and 0.1% probability of the occurrence of an event in any given year. The high probability events occur more frequently and are smaller, and the low probability events occur more rarely and are bigger. The raster output also contains information about the depth of flooding. See Use Case 6.2 - National Risk Analysis for how this hazard information can be used to carry out a risk analysis at a national scale.
Below is an example of the indicative flood hazard output for the Belize City area, showing the 1-in-100 year fluvial (river) and pluvial (rain) flood hazard as well as the hurricane category 5 storm surge flood hazard.

Click here for the full National Belize (return period) mapped output. It can also be found under Flood Hazard Map from the Countries tab/Maps.
It should be noted that the flood hazard layers represent the same probability of hazard at every point along a river system, for consistent planning purposes. However, this does not normally occur all at the same time, or even in the same flood event, so it can be seen as a composite map of multiple events along the river of the same probability.
The different probability hazard extent/depth layers can be combined into simpler to use hazard categories, depending on a user’s needs. For the Belize National Flood Hazard Map, the 5, 10, 20, 50 and 1000 year probabilities results have been combined into one hazard category layer where each grid cell is assigned a simple number category depending on which probability flood occurs in that location. This means that areas that flood more regularly (i.e. high probability/low return period e.g. 5 year return period) close to the river can be classed as high risk and areas further away from the river, that only flood rarely, can be classed as low risk.
Validation of the model results shows that general patterns of flooding from the modeling are in-line with previous understanding of flood hazard as defined in the King et al 1992 geomorphological assessment of flood hazard areas (a spatial cross-validation shows a 74% agreement in flooded areas). However, the NFHM provides more detail in a spatially accurate and consistent manner, as was the aim of the assessment. Below are a few illustrations of the model output compared to aerial photographs from the NEMO reports.

Burrel Boom – Northern Highway: Tropical Depression No.16, October 2008

Crooked Tree Causeway: Tropical Depression No.16, October 2008

Kendal Bridge destroyed (black circle), Southern Highway: Tropical Storm Arthur, June 2008
Limitations
Due to modeling being an approximation of reality, the importance of understanding the limitations of any modeling exercise cannot be overstated. There are many limitations to modeling rivers at this scale on a data scarce context, and they will result in limitations on the accuracy of the modeled outputs. While the numerical methods (water flow calculations) are well proven, they are limited by the accuracy and quality of the input data to the model. In particular, major limitations exist at a local scale, due to the coarse resolution (~90 m) and noise error of the current “best” digital elevation data available (Shuttle Radar Topography Mission). The elevation data has also been corrected for vegetation and urban areas, but at a resolution of ~250 m, resulting in some residual error which affect the quality of the results. This hazard mapping represents the current best available output given these data constraints.
At a national scale, the aim is to use the flood map to get an appreciation of spatial extent of flood hazard over large areas, and therefore many of these accuracy limitations are less important. However, as you zoom in on the results, these limitations become more important. It is therefore important that these results are not used below a map scale of 1 in 50,000. This means that it is possible to estimate the flood risk to a district, but not to an individual house. The model results are also not for to be used in engineering design, as they do not contain many of the details needed at the construction scale. Typically the national hazard map will highlight where there is a predominant flood hazard and will indicate (hence the term indicative flood hazard) the need to do more detailed modeling with better topography and river channel data in these areas for detailed planning and engineering design.
Conclusions:
-
The assessment of national fluvial flood risk is a complex task and requires a lot of input data and expertise. However the basic concept of simulating water through a geometrical representation of the river channels and surrounding floodplain should hopefully be clearer at the end of this Use Case.
-
The specific method used for Belize has been described, but similar hydrodynamic methods are used for the Caribbean Islands in the CHARIM project, albeit with more varied local data and at a different scale. However, the basic concepts and aims are similar.
-
While the results of the modeling have shown some skill in representing known flood hazard, the reader should also be strongly aware of the limitations on the accuracy of these results.
-
Improving the results of this scale of modeling will only come from national investment in high quality topography data such as LiDAR and long term hydro-met measurements of rivers and rainfall, as well as recording flood events for validation. This investment will also pay off at a local scale where these higher accuracy data can also be used for more detailed flood studies.
Last update:
14-07-2016
Post new comment